APPLICATION OF THE 3-CORNERED HAT METHOD TO THE ANALYSIS OF FREQUENCY
STABILITY
W.J.
Riley, Hamilton Technical Services
Any frequency stability measurement includes noise contributions from both the device under test and the reference. Ideally, the reference noise would be low enough that its contribution to the measurement is negligible. Or, if the noise of the reference is known, it can be removed by subtracting its variance. A special case is that of two identical units where half of the measured variance comes from each, and the measured deviation can be corrected for one unit by dividing it by Ö2. Otherwise, it may be useful to use the so-called "3-cornered hat" method for separating the individual variances. Given a set of three pairs of measurements for three independent frequency sources a, b and c whose variances add:
s²ab= s²a + s²b
s²ac= s²a + s²c
s²bc= s²b + s²c
The individual variances may be separated by the expressions:
s²a= ½ [ s²ab + s²ac - s²bc ]
s²b= ½ [ s²ab + s²bc - s²ac ]
s²c= ½ [ s²ac + s²bc - s²ab ]
The Stable32 program includes a 3-Cornered Hat function for performing this calculation. Although useful for determining the individual stabilities of units having similar performance, the method may fail by producing negative variances for units that have widely differing stabilities, if the units are correlated, or for which there is insufficient data. The three sets of stability data should be measured simultaneously. The 3-cornered hat method should be used with discretion, and is not a substitute for a low noise reference. It is best used for units having similar stability (e.g. to determine which unit is best). Negative variances are a sign that the method is failing (because it was based on insufficient measurement data, or because the units under test have disparate or correlated stability). This problem is most likely to arrise at long tau.
To use the Stable32 3-Cornered Hat function to separate the variances of three frequency sources that have been measured in pairs, stability data for the three sets of measurements (A-B, A-C and B-C) is read and processed to yield stability data for the individual units (A, B and C). The stability data can be obtained from the Run function, or it can be created manually by a text editor (e.g. Windows Notepad). The stability data must be in a tabular format comprising three required and two optional columns:
| Tau | # | Sigma | Min Sigma | Max Sigma |
The # values are not used, and may all be set to 1. The max and min sigma values are optional.
The corrected stability data may be viewed, printed, copied to the Windows Clipboard, or plotted. Options, lines and annotations may be added to the plot, and it may be viewed, printed, saved, or converted to another graphics format. The output options of the 3-Cornered Hat function resemble those of the Read function.
When analyzing stability data for processing by the 3-Cornered Hat function, it is wise to plan the designations of the three units, and assign corresponding stability filenames for them with the Files function before performing a stability analysis for them with the Run function.
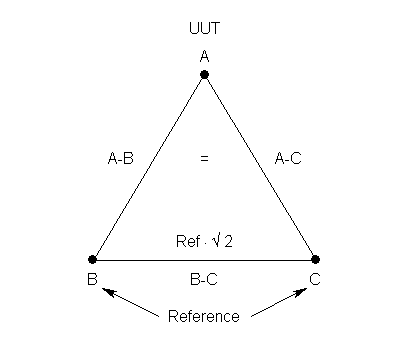
The Stable32 3-Cornered Hat function may be used to correct a stability measurement for the noise contribution of the reference, as shown in the following diagram:

The Unit Under Test (UUT), denoted as source A, is measured against the reference, denoted by B and C, by identical stability data files A-B and A-C. The reference is measured against itself by stability data file B-C, which contains the a priori reference stability values multiplied by Ö2.
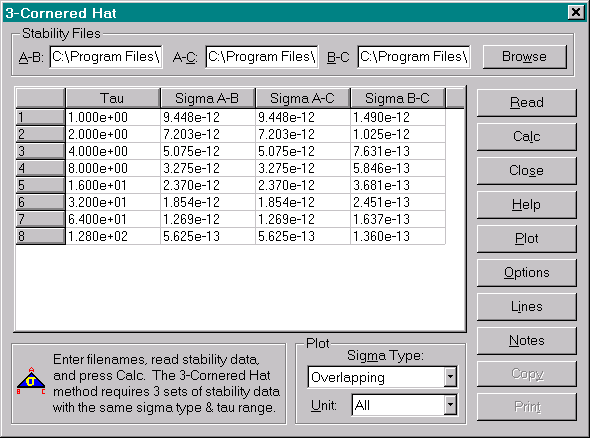
An example of the use of the 3-cornered hat function to correct stability data for reference noise is shown below. Simulated overlapping Allan deviation stability data for the unit under test versus the reference was created by generating 512 points of frequency data with tau = 1 second and sigma(1) = 1e-11, and analyzing it with the Run function. The resulting stability data table is shown in the following table. When using a stability table in the 3-Cornered hat function, the # column must be included, but is not used by the 3-cornered hat analysis, and the min and max sigma columns are optional. This stability data file is entered for both the A-B and A-C inputs, representing two measurements of the UUT versus the reference.
| Stability Data for Unit Under Test versus Reference | ||||
| Tau | # | Sigma | Min Sigma | Max Sigma |
| 1.000e+00 | 511 | 9.448e-12 | 9.108e-12 | 9.830e-12 |
| 2.000e+00 | 509 | 7.203e-12 | 6.923e-12 | 7.520e-12 |
| 4.000e+00 | 505 | 5.075e-12 | 4.826e-12 | 5.367e-12 |
| 8.000e+00 | 497 | 3.275e-12 | 3.058e-12 | 3.546e-12 |
| 1.600e+01 | 481 | 2.370e-12 | 2.157e-12 | 2.663e-12 |
| 3.200e+01 | 449 | 1.854e-12 | 1.720e-12 | 2.025e-12 |
| 6.400e+01 | 385 | 1.269e-12 | 1.147e-12 | 1.441e-12 |
| 1.280e+02 | 257 | 5.625e-13 | 4.820e-13 | 7.039e-13 |
A similar stability file is used for the reference. Since it represents a measurement of the reference against itself, the Allan deviations of the reference source are are multiplied by Ö2. Simulated overlapping Allan deviation stability data for the reference versus the reference was created by generating 512 points of frequency data with tau = 1 second and sigma(1) = 1.414e-12.
| Stability Data for Unit Under Test versus Reference | ||||
| Tau | # | Sigma | Min Sigma | Max Sigma |
| 1.000e+00 | 511 | 1.490e-12 | 1.436e-12 | 1.550e-12 |
| 2.000e+00 | 509 | 1.025e-12 | 9.854e-13 | 1.070e-12 |
| 4.000e+00 | 505 | 7.631e-13 | 7.257e-13 | 8.070e-13 |
| 8.000e+00 | 497 | 5.846e-13 | 5.458e-13 | 6.329e-13 |
| 1.600e+01 | 481 | 3.681e-13 | 3.349e-13 | 4.135e-13 |
| 3.200e+01 | 449 | 2.451e-13 | 2.152e-13 | 2.924e-13 |
| 6.400e+01 | 385 | 1.637e-13 | 1.368e-13 | 2.173e-13 |
| 1.280e+02 | 257 | 1.360e-13 | 1.058e-13 | 2.285e-13 |
When these stability data are entered into the Stable32 3-Cornered Hat function, the following screen display will be seen:

After performing the 3-cornered hat calculation, the following will be seen:

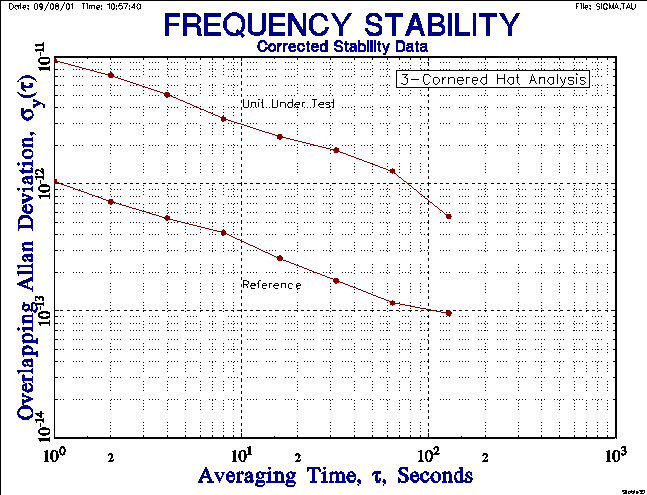
The corrected UUT and reference stabilities may be plotted as shown below:

Here the reference stability is about 1x10-12t-1/2 and the corrected UUT instability is slightly less than the uncorrected values. Note that the B and C columns of corrected stability values both represent the reference source. Appropriate use of the 3-cornered hat method to correct stability measurements for reference noise applies where the reference stability is between 3 to 10 times better than that of the unit under test. The correction is negligible for more the latter (see above), and has questionable confidence for less than the former (and a better reference should be used). No error bars are included on the stability plot, nor does the Stable32 3-Cornered Hat analysis consider the covariances between the sources.
The error bars of the separated variances may be set using C² statistics by first determing the reduced number of degrees of freedom associated with the 3-cornered hat process (see Reference 10). The fraction of remaining degrees of freedom for unit i as a result of performing a 3-cornered hat instead of measuring against a perfect reference is given by:
G = (2·s4i) / (2·s4i + s²a·s²b + s²a·s²c+ s²b·s²c)
The ratio of the number of degrees of freedom is 0.4 for three units having the same stability, independent of the averaging time and noise type.
M CLOCKS
The 3-cornered hat technique can be extended to M clocks (subject to the same restriction against negative variances) by using the expression (see Reference 11):
where:
and the s²ijare the measured Allan variances for clock i versus j at averaging time t. Using s2ii=0 and s2ij=s2ji, one can easily write closed-form expressions for the separated variances from measurements of M clocks.
REFERENCES
The following references apply to the 3-cornered hat method for frequency stability analysis:
3-CornHat.htm
1/1/03