| |
Stability Plot |
|
|
Next Page |
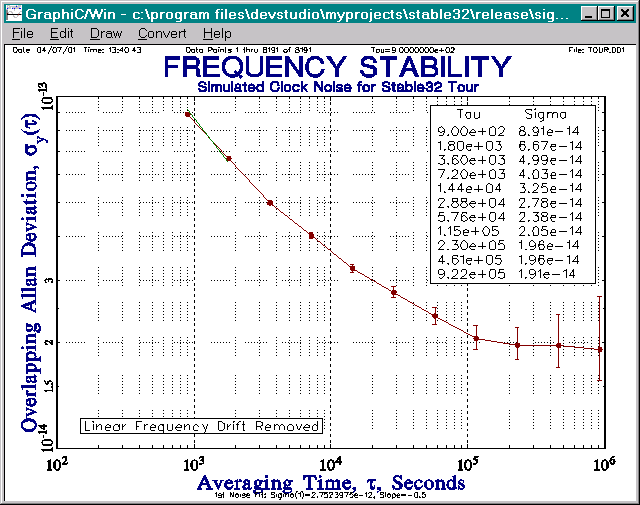
| This is a plot of the frequency stability, which is often the main result of a frequency stability analysis. It includes a sigma-tau table and a fit to a white FM noise model at the two shortest averaging times. The plot agrees well with the simulation parameters of 2x10-12t-1/2 + 2x10-14. | ||
 |
||
| Stability Plot |
|
Page 14 of 15 |